
A data-driven analysis of fundraising & investment cadences, fund strategies, and more
The European VC ecosystem has been growing and maturing rapidly over the last decade. Between 2010 and 2020, venture capital fundraising grew 6 fold to nearly $24B. Although still far short of the record $73.6B the US ecosystem raised in 2020, it represents an impressive leap and is about 1.5 times the rate of growth that US fundraising experienced over the same period.
While we’ve always monitored international venture ecosystems as a component of our work, we’re pleased to announce that we’ve now formally expanded our extensive VC dataset to encompass European firms in addition to US VCs. Over time, we’ll be incorporating these funds into our venture navigator. But for now, we’re previewing some of this data in a high level comparison between Europe and the US.
The following is our assessment of the European VC ecosystem, based on a sample of 600 European firms investing venture capital across 74 unique European metro areas, comparing it to our existing dataset on 1,500+ US VCs.
Geographically Concentrated in the Top 3 Countries, but Less Concentrated than VC in the US
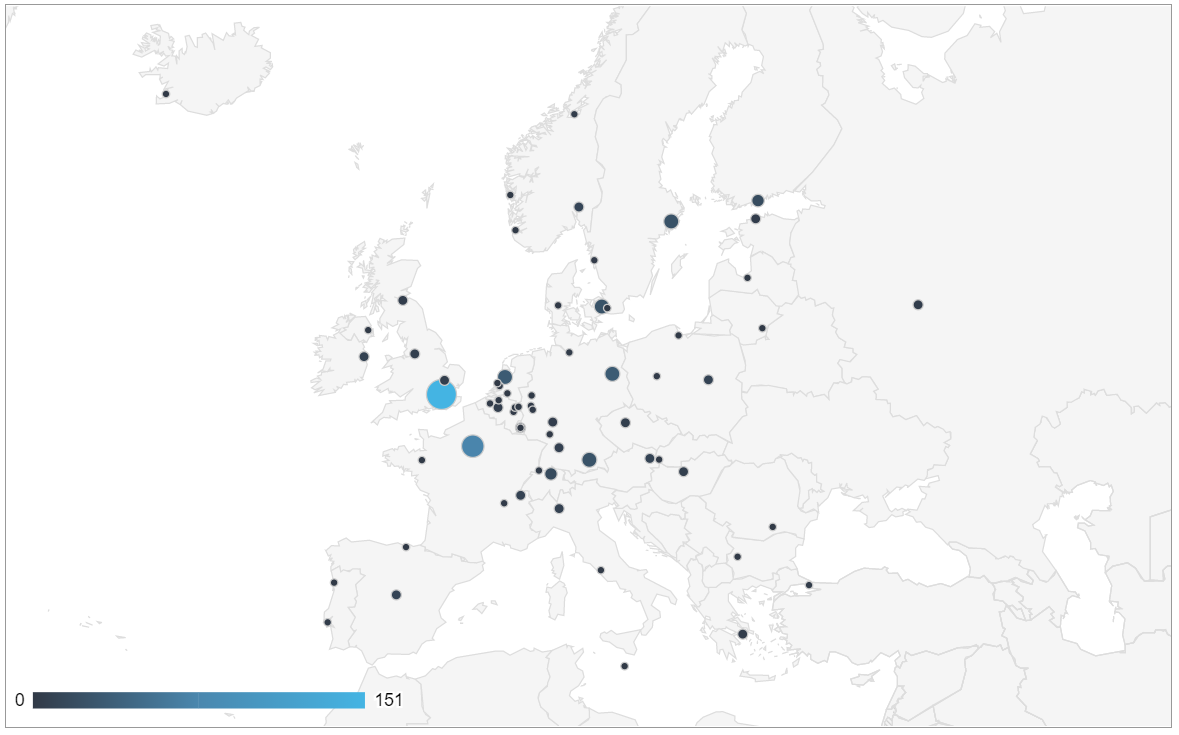
By our assessment, 28% of European VCs are headquartered in the United Kingdom, with another 13% in Germany and 12% in France. The remaining 46% of firms are spread across 28 more European countries.
At the metro area level, London is the most common city for VC headquarters in Europe, with 25% of the firm count. Paris accounts for another 12% of VCs, with Amsterdam and Berlin each garnering just over 5%.
Although this appears fairly concentrated in the top 3 markets, compared to the US it’s actually moderately dispersed. We estimate a full 35% of VCs in the US are headquartered in the Bay Area alone.
Smaller Emerging Manager Ecosystem with More Non-Traditional Structures
Compared to the US venture capital landscape, our analysis suggests that the emerging manager ecosystem in Europe accounts for slightly less of the overall European market.
Whereas 40% of US VCs are debut funds and 83% are emerging managers (Funds I-III), in Europe we estimate debut funds account for just 34% of the traditional VC market and emerging managers account for 77%.

We also found a significantly larger alternative structure ecosystem in Europe. Encompassing everything from the now hotly talked-about rolling funds on AngelList to evergreens to CVCs, alternative structures are a relatively small part of US VC, accounting for only 13.5% of the firm count (and even less of the overall capital share). Comparatively, in Europe we estimate a full 30% of firms leverage alternative structures.
Although CVCs are by far the most common alternative structure in Europe (at 14% of firms, compared to 5% in the US), there’s also a more robust population of evergreen funds, which account for 4% of European VCs but only 1% of US VCs. And, the European ecosystem features a number of structures that are essentially nonexistent in the US: namely, publicly traded funds (1.3% of European VCs), government funds (1% of VCs), (S)EIS funds in the UK, and VCs that are fully funded by the GPs (4.6% of VCs).
This last category, while encompassing separate venture arms of FOs and MFOs (which also exist in the US, though often without the kind of explicit, public-facing presence of those in Europe), also features funds that basically appear to be more formally structured angel groups. These “private VCs” choose not to raise outside capital, instead pooling together just the assets held by the partners of the firm. Unlike angel groups, there’s typically fewer than 5 GPs providing capital, all partners are involved in the investment decision process, and they adopt strategies more reflective of traditional VCs.
| Europe | United States | |
| CVC | 14% | 4.5% |
| Evergreen | 3.9% | 1.1% |
| Government Fund | 1.1% | ~0% |
| Publicly Traded Fund | 1.3% | ~0% |
| FO / MFO VC Arm | 3.4% | 0.9% |
| Private VC | 1.3% | ~0% |
More Likely to Have Second Offices than US VCs
European VCs have a greater likelihood of maintaining a second (or third or fourth) full-time office than do US firms.
Whereas just 17% of US VCs have an additional office beyond their HQ, 38% of European VCs (twice as many) hold one or more secondary offices. And, these secondary offices are more likely to be outside the country of the firm’s headquarters.
Even among US VCs with secondary offices, only 29% have an international presence. By comparison, 90% of European firms with secondary offices place that office outside their home country and 51% have an office outside the EU. (Of note, about half of geographically spread European VCs have a full-time US office, meaning around 16% of European firms have a US presence.)
Larger Teams, Fewer GPs of Color
European firms are managed by, on average, 4.4 GPs. In the US, the average firm has 3 GPs. Similarly, the median European VC has 3 GPs compared to 2 in the US.
Of particular interest, solo GPs (a quite common trend in the US) are exceptionally rare in Europe. While a full quarter of US VCs are managed by just one GP, in Europe we estimate less than 10% of firms are solo GPs. Though impossible to say for certain, perhaps this is reflective of America’s world-class proclivity for individualism.
Concerning diversity, the US and Europe exhibit similar levels of female representation at the partner level: in both regions, 16-17% of GPs are women. However, European firms are a bit less likely to have all-male GP teams. Whereas 59% of European VCs have exclusively male partners, 67% of US VCs are all-male.
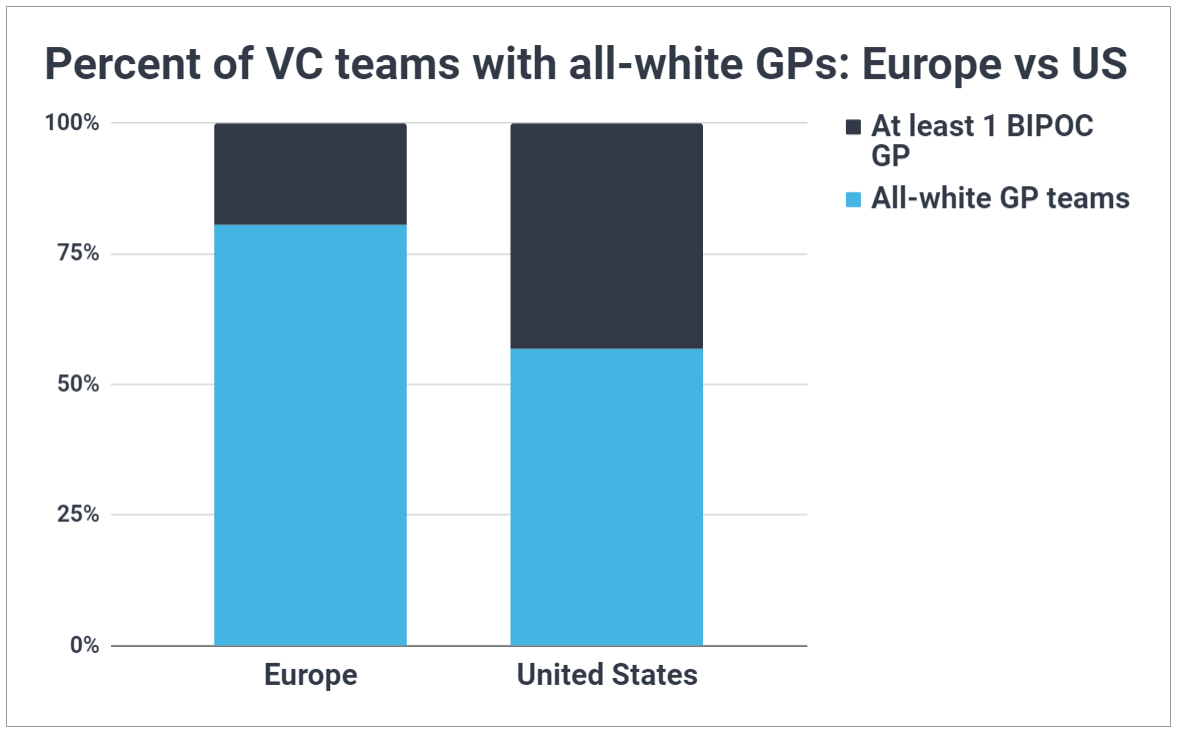
In contrast, European VCs have significantly less BIPOC representation at the GP level than US firms. While 27% of US GPs are BIPOC, we estimate that figure falls to just 8% for European VCs. Further, 80% of European firms are managed by all-white partner teams compared to 57% in the US. Of course, differences in demography lead to natural differences in equitable BIPOC representation, but clearly both regions have a ways to go to achieve racial equity.
Slower Investment Pace, Longer Fundraising Cycles
We found that fundraising cycles, while contracting for established VCs in the US, are quite a bit longer in Europe.
Whereas the median US VC raises a new flagship fund every 2.9 years, in Europe that number jumps to every 4 years. (The average similarly rises from 3.2 in the US to 4.4 in Europe.)
Investment paces, too, appear longer in Europe. Compared to the median US VC which averages 5.6 new portfolio companies each year, the median European VC is averaging just 3.6 new portfolio companies per year. Whether this is reflective of a greater tendency towards high-conviction, value-add investing in Europe or simply less availability of capital and fast-growing startups is debatable.
More Likely to Invest Across Asset Classes
In the US, it’s relatively rare for a VC firm to dabble in other asset classes (like private debt, real estate, infrastructure, etc.). By our estimates, just 1.6% take such a multi-asset approach, with the vast majority preferring to specialize exclusively in venture capital and private equity. However, in Europe we estimate nearly 6% of VCs also invest in non-VC/PE asset classes. Though still a small percentage overall, it’s a significantly higher rate of diversification than in the US.
Despite being more likely to invest across asset classes, European VCs show similar preferences for multi-stage investing as US VCs. In both regions, approximately a quarter of firms (26%) leverage portfolio construction that invests at both the early stages (pre-seed through Series B) as well as later stages (Series C through PE).
| Europe | United States | |
| Multi-stage approach | 25.7% | 26.3% |
| Multi-asset approach | 5.6% | 1.6% |
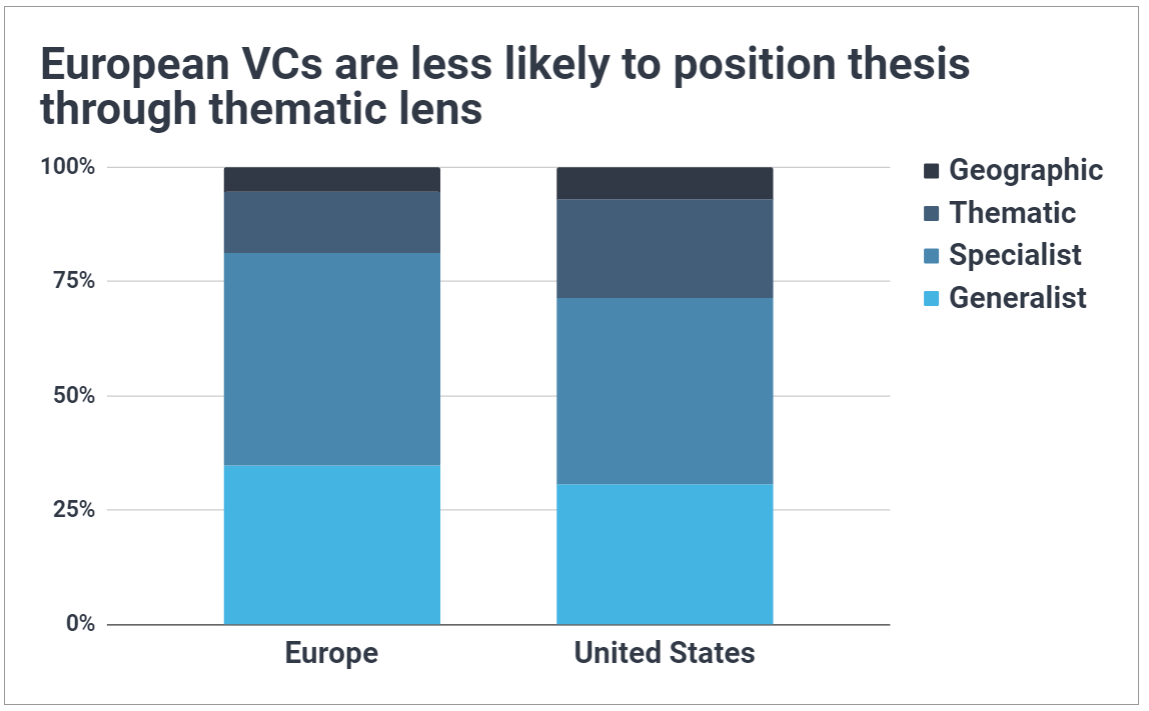
Fewer Thematics
Turning to investment strategy, we found European VCs are less likely than those in the US to position their thesis through the lens of a theme, preferring instead either generalist or specialist approaches.
As far as sector preferences, we found a few notable differences between US and European firms. According to our analysis, European VCs are more likely to invest in GreenTech and SDGs, Industry 4.0, Smart Cities, the Circular Economy, Travel, Industrial Tech, Fashion/Luxury, and Digital Health. There are, of course, more sectors that could be added to this list, but we draw attention to these for their obvious connections to Europe and its economies.
Before Investing, Be Aware of Differing Norms and Industry Standards
While there are certainly similarities between the US and European VC ecosystems, there are perhaps more differences than initial expectations would suggest.
As an LP, do these differences matter?
Well, if you’re looking to start expanding your investment footprint to cover a new region, understanding differences in industry standards and having a fuller picture of the market landscape is definitely relevant for setting expectations and developing a successful investment strategy.