Data shows steady growth in the number of LPs per venture capital fund over the last 5 years — what types of VC firms have benefited the most from this inflow, and what does that imply about evolving LP preferences?
Limited partners in venture funds, generally speaking, are an incredibly opaque breed.
Excluding those with a mandate to release periodic data (e.g. pensions or endowments), basic information — like total AUM or percent allocated to venture — is rarely disclosed. Even those with such disclosure mandates often keep much of the meaningful detail underwraps (or, at the least, buried deep in their website).
Although the Black Lives Matter-driven push for a more transparent venture ecosystem has partially expanded the universe of LPs releasing data on the diversity of their managers, very little is publicly known about these investors’ decisions, preferences, and portfolios (other than what they anonymously self-report in the occasional survey).
So, in an effort to uncover some trends in the allocations and preferences of venture LPs at scale, we decided to leverage our data on LP participation into more than 2,800 VC funds (based on SEC filings and published articles) to offer quantitative assessments and posit potential implications.
VC Funds are Experiencing a Surge in LP Participation
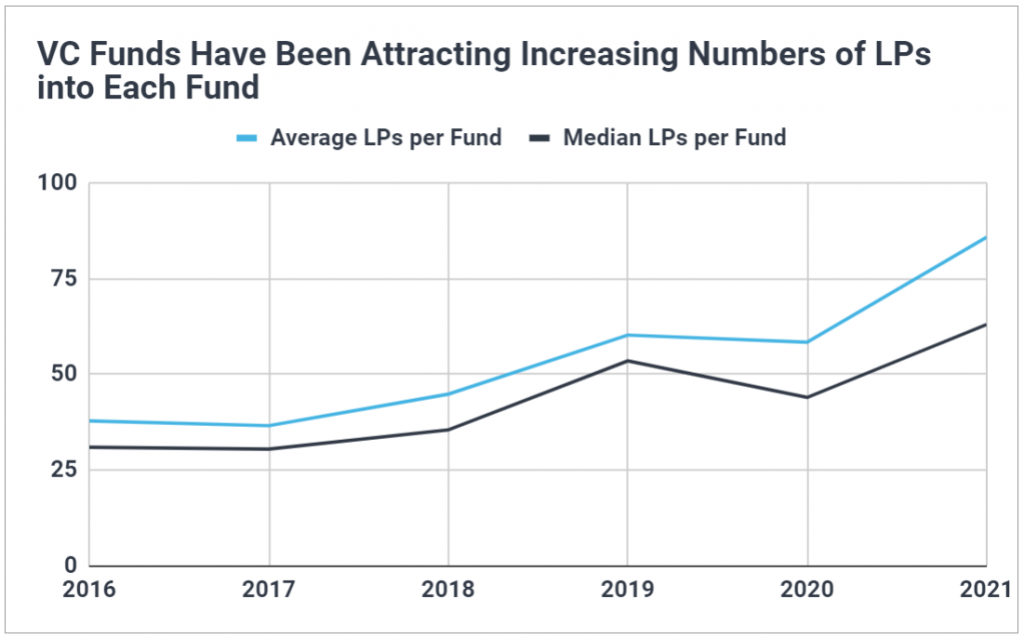
VC funds today have more LPs in a given investment vehicle than ever before.
Over the last five years, the average number of LPs participating in a VC flagship fundraise has more than doubled to a figure of 86 thus far in 2021. Implying this growth is not simply a result of outlier skew at the upper extreme, the median has similarly more than doubled to 63 LPs per fund in 2021 (YTD).
It’s reasonable then to infer the self-reported claims of LPs’ increasing interest in allocating to venture have not simply been hot air: more and more accredited investors and institutions really are tapping into venture markets. And at least for now, it appears VCs are making room for these new LPs, increasing their list of backers to accommodate growing interest.
And how have VCs accommodated a growing body of interested LPs? The data suggests that rather than accepting smaller checks from a wider range of investors, VCs have simply been growing their fund size each time a new investor knocks.
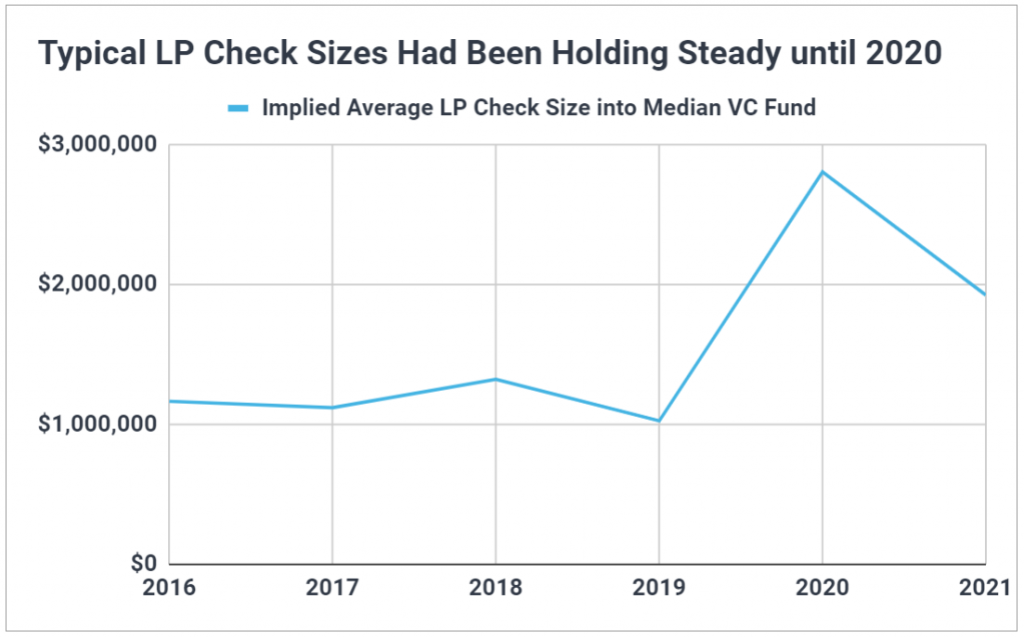
As the following chart shows, through 2019, the implied average check size (total raised divided by number of LPs) into the median VC fund held quite steady, at just over $1M. A flat trend in average checks coupled with a growing number of participants over the same period meant the typical VC fund was steadily growing — more checks of equal size pushes fund size up in direct proportion to the increase in number of LPs.
But 2020 brought about a drastic shift.
Last year, while the median number of LPs participating in a flagship raise dipped slightly, the implied average check size for the median fund skyrocketed to nearly $3M. This suggests that although a small portion of LPs got cold feet from the pandemic, many more actually upped their allocation to venture. These investors wrote exceptionally large checks for the mega funds that dominated the fundraising landscape (perhaps a result of the unexpected reverse denominator effect many experienced as the stock market roared ahead).
And notably, 2021 is seeing not only continued, though slightly lower, check sizes (with the median VC fund averaging about $2M from each LP), but also record-breaking numbers of participating LPs. The combination of these two events helps explain how VCs managed to raise 92% of 2020’s record-breaking amount in just the first half of the year. VCs are taking bigger checks than ever from more LPs than ever.
Unsurprisingly, Mega Funds Have Experienced the Most Growth in LP Participation
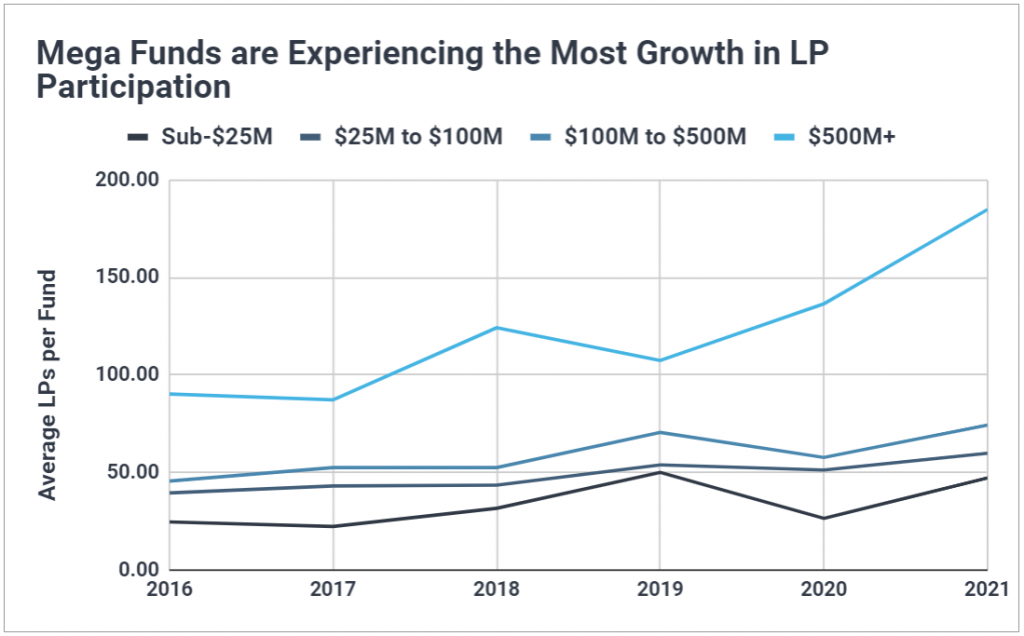
Though now a tired storyline, mega funds appear the primary benefactor of growing LP interest in venture capital.
Between 2016 and 2021, we estimate the average number of LPs participating in a mega fundraise ballooned from about 90 to over 180, with no sign of a dip in 2020.
However, this isn’t to say that all other fund size classes have been left behind. In fact, sub-$25M funds have also nearly doubled their average number of LPs per raise, from roughly 25 in 2016 to almost 50 so far in 2021. It appears, then, that there’s growing interest in venture from accredited investors with a wide range of capital resources and a wide range of fund size preferences. This is particularly promising for the vast majority of VC firms raising funds in the sub-$100M class. These firms are generally unable to access big-pocketed institutional investors and rely on the (now growing) smaller check-writing individuals.
But, importantly for understanding the dynamics of last year, every fund size class other than mega funds witnessed a sharp decline in LP participation for 2020 raises. Demand boomed for mega funds and shriveled for the lower ends of the fund size spectrum.
This makes glaringly clear the primary effect the pandemic had on US venture capital: it was one of the easiest years yet to be a mega fund, while simultaneously one of the hardest to be anything else.
Fortunately, 2021 has so far seen a return of growth in LP participation across the board.
What Types of VC Firms are LPs Most Gravitating Towards?
While a survey of LPs could certainly shed some light on stated VC firm preferences, it’s also worth looking at what LPs’ actions imply about their actual preferences (recognizing limitations). One way to estimate this is to see what types of VC firms have experienced the most growth in investor participation.
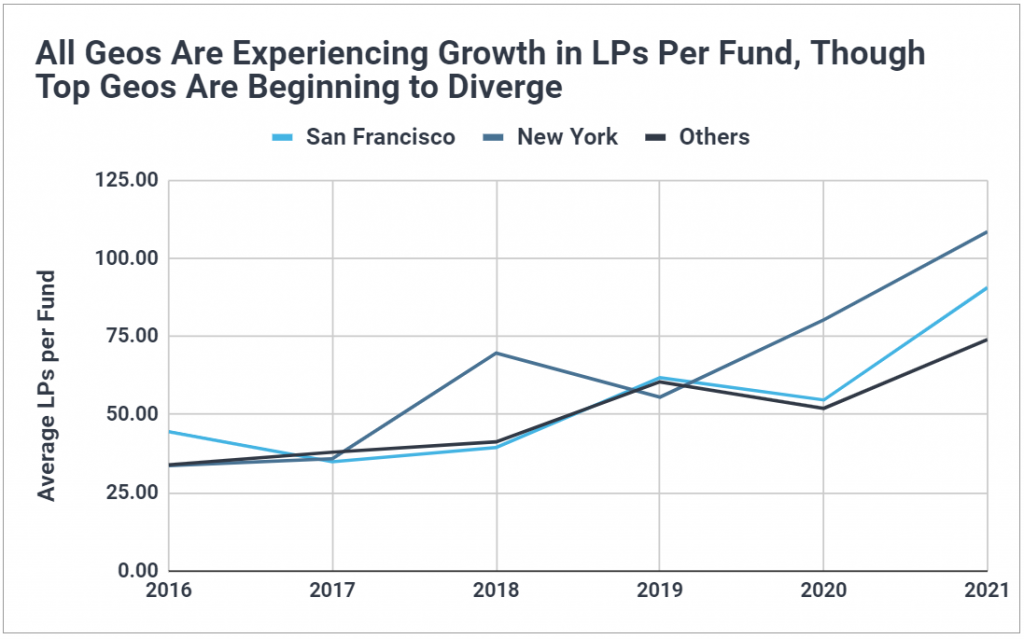
Historically, the average number of LPs per fund varied little between the San Francisco Bay Area, New York Metro, and the rest of the US. But in recent years they have begun diverging.
Notably, so far in 2021 New York VC funds have attracted the highest average, with nearly 110 LPs per fund. This year, the Bay Area also split from the numbers for the rest of the US by reaching an average of 91 LPs per fund. Every other geography (though seeing some growth) has fallen behind at an average of 74 LPs per fund.
If this is a sign that a greater portion of new LP entrants to venture are preferring the two largest markets over emerging ecosystems, it could counteract the prevalent storyline that limited partners are finally becoming more open to non-traditional regions.
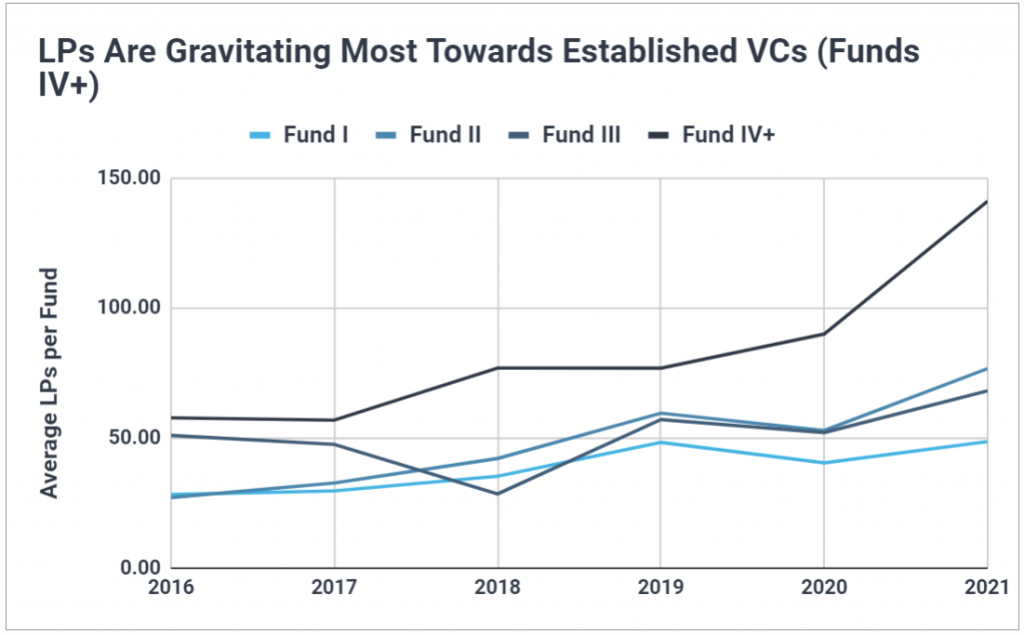
Unsurprisingly, LP numbers are also increasing the most for established VC firms (Fund IV+).
Over the last five years, the average number of LPs for Funds IV+ rose 144%, compared to 72% for Fund Is. This has left the average Fund IV+ with nearly 3 times as many LPs as the average debut fund.
Interestingly, Fund IIs have also experienced significant growth in the average number of LPs per fund, actually having a greater average than Fund IIIs. Whether this represents an increased willingness by LPs to back managers with a well-performing debut fund is debatable (it could also simply be a function of the step-up between a small, pilot Fund I and a larger, track-record-based Fund II).
But it’s nonetheless promising to see growth in LP numbers across all fund numbers.
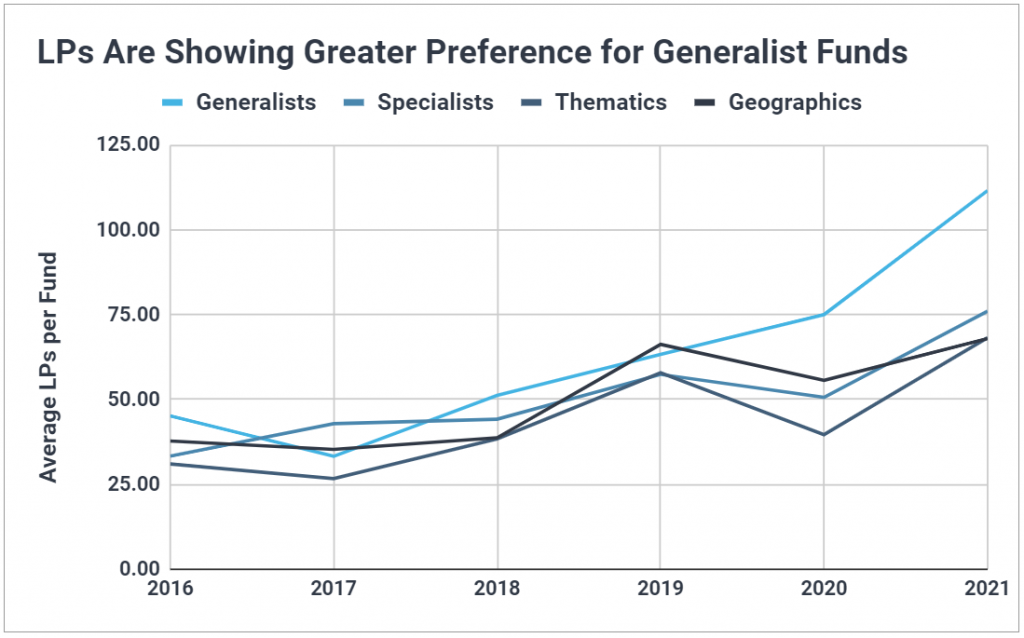
As far as thesis strategies, generalist VC firms have witnessed the greatest growth in LP participation, with other strategies (specialist, thematic, and geographic theses) more or less tracking each other. This may imply LPs are tending more towards generalists, but it’s also important to remember mega funds and established firms are much more likely to adopt a generalist strategy, which could be the real driver of this trend.
What About Non-Traditional Fund Structures?
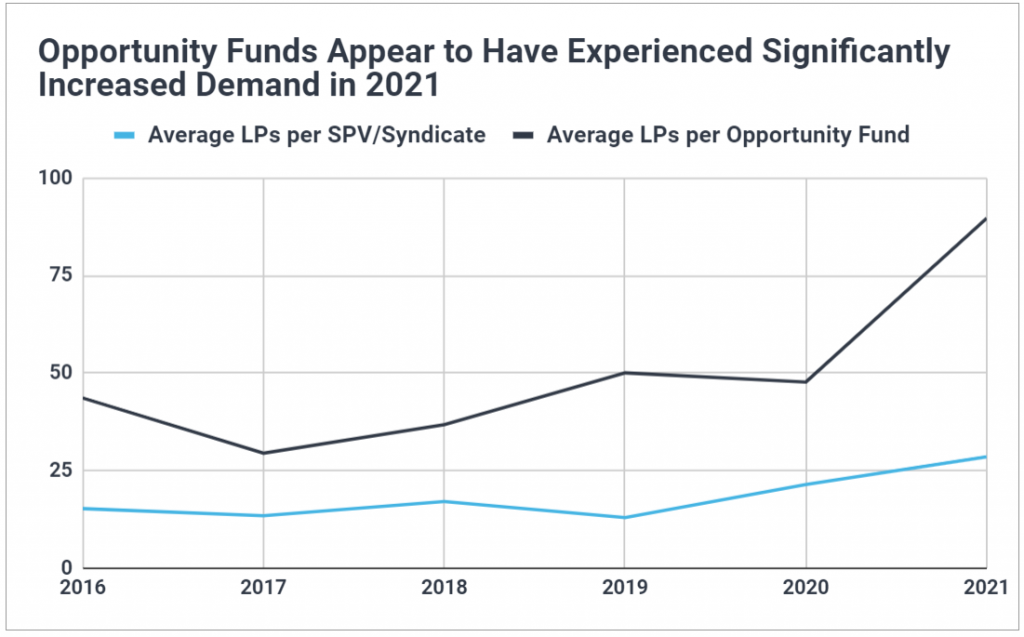
So far, this analysis has focused exclusively on LP participation in VC firms’ flagship funds. But non-traditional structures (e.g. opportunity funds, SPVs, etc.) are an increasingly relevant part of the VC fund ecosystem. How has LP participation changed in these vehicles?
While the average number of LPs in both opportunity funds and SPVs had been steadily growing since 2016, 2021 has so far seen a particularly striking jump in LP participation in opportunity funds. These vehicles (designed to fuel growth in a firm’s most promising startups as they mature) have seen the average number of LPs climb from around 50 in the last two years to nearly 90 in 2021.
That opportunity funds average about the same number of LPs as flagship funds, and these vehicles are often raised simultaneously, may suggest it’s become rare for a VC firm to offer an opportunity fund and not have the vast majority of its existing LP base join.
SPVs & Syndicates, meanwhile, have experienced moderate increases, but still average fewer than 30 LPs per vehicle.
Will the Upward Trend in LP Participation Continue?
Clearly, there are more LPs participating in VC fundraises than ever. Whether for mega funds or debut funds, generalist strategies or thematics, Bay Area firms or elsewhere, LP numbers are increasing across the board.
And while this is great for the asset class — allowing more firms to put more capital to work in innovative startups — it’s not guaranteed the trend will continue.
If LPs new to the asset class struggle to reach return expectations with their initial fund commitments, their allocations to venture may prove fickle. If their allocations ebb, we may see a contraction in the venture market (as many expected at the onset of the pandemic). That could have wide-ranging impacts on the startups that operate as engines of job growth and innovation.
But of course, that’s just conjecture.
Because at least for now, it’s arguably never been a better time to raise a VC fund.
